These are the five replacement directions we found after benching AvesCal-PH. Each one is shown as a simple system mockup so you can understand the problem, the data, the computer-science work, and the biggest risk before bringing it to your group or adviser.
How to read this pageStart with the mockup on the right. Then read “Think of it like this” and the four-step flow. The mockups are explanatory concepts only — they are not finished systems and they do not show claimed research results.
Important: the numbers below are screening scores from the replacement search, not final title-approval scores. A candidate still has to pass its real-data “kill gate” before we should lock it as a thesis.
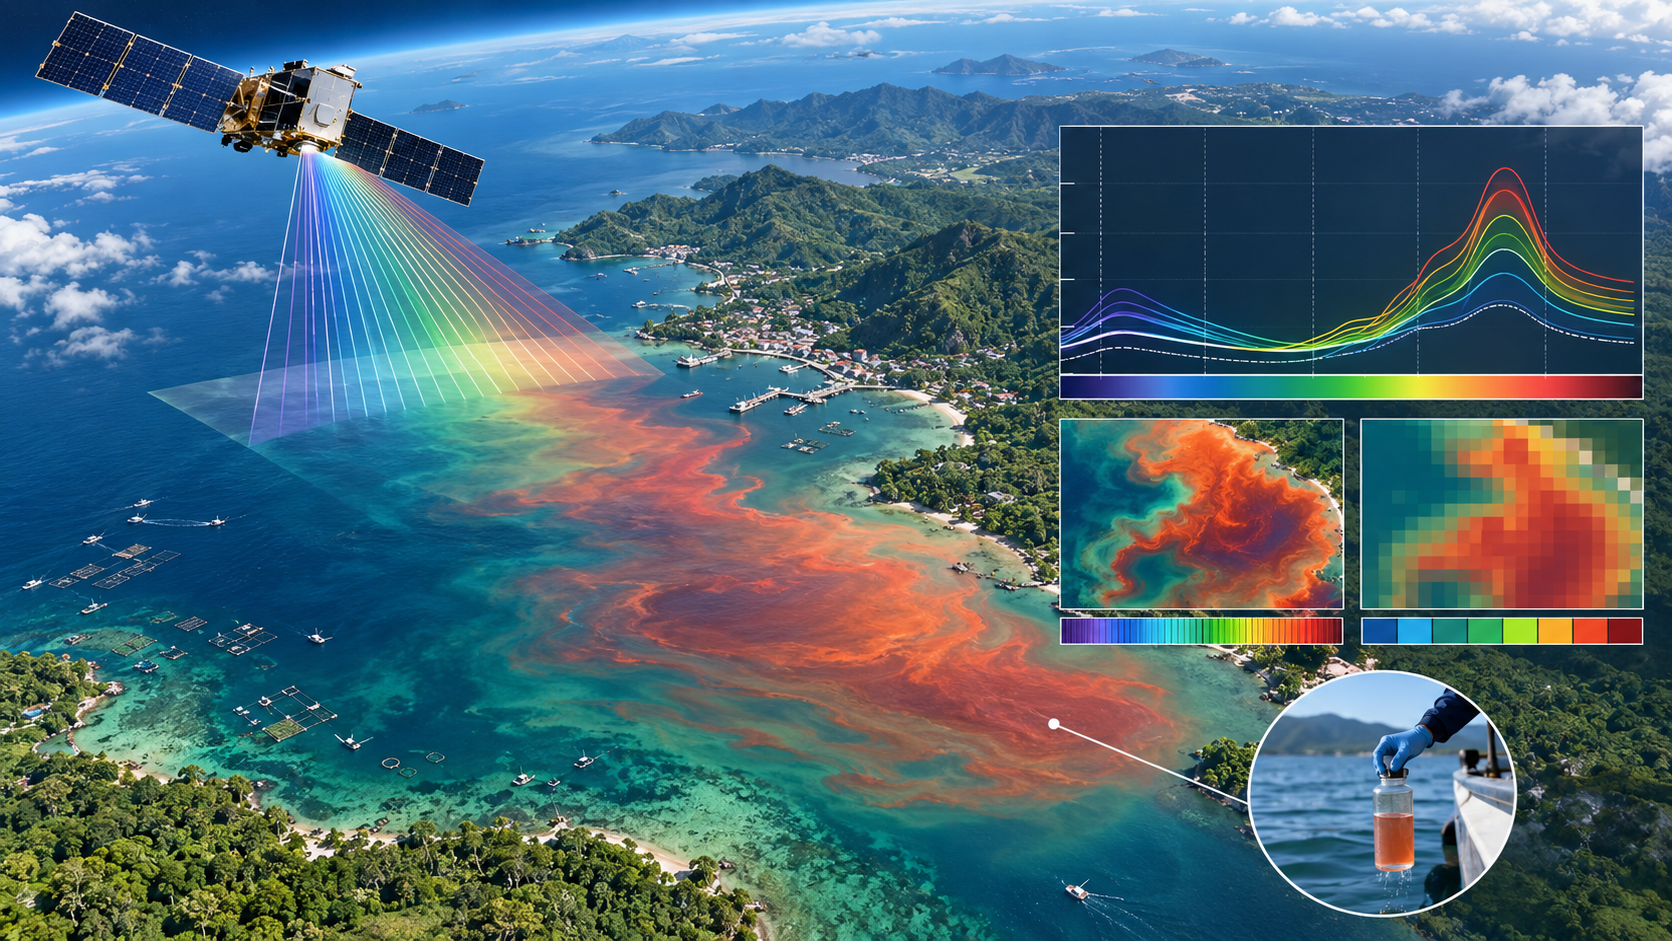
Can a new hyperspectral satellite improve Philippine red-tide screening?
93/100
Strongest clean data pathNASA PACEBFAR bulletins
The system looks at the color “fingerprint” of coastal water from NASA PACE and checks whether it matches periods when BFAR reported red-tide conditions. It then compares that newer hyperspectral signal with older satellite methods.
Think of it like this: older satellites see the ocean with a few color channels. PACE sees more than 200 spectral bands. Your thesis asks whether that extra detail actually helps in Philippine bays.
1. ReadPACE ocean-color spectra
2. MatchBFAR bay + date bulletins
3. ComparePACE vs legacy sensor baseline
4. TestUnseen bay/date + confidence
What makes it CS
Geospatial/time matching, hyperspectral feature engineering, ML calibration, held-out validation, and a web evidence viewer.
Public data
PACE OCI + BFAR red-tide archives, with MODIS/Sentinel-3 as comparison baselines.
Research gap
A Philippine MODIS/XGBoost study already exists. The new question is whether PACE’s richer spectrum adds transferable value.
Main kill gate
Need enough cloud-free PACE scenes matched to positive and lifted/negative BFAR bulletins across several bays.
Concept image — hyperspectral coastal monitoring
Illustrative concept: PACE hyperspectral observations could be paired with coastal bloom patterns and BFAR reference bulletins. This is not a measured study result.
Concept mockup — coastal screening dashboard
PACE-HAB-PH / Davao Gulf
Red-tide evidence reviewSCREENING ONLY
Coastal map + bloom signalRisk evidence 0.78
Hyperspectral anomaly near monitored bay
Spectral fingerprint
BFAR bulletin: POSITIVEMatched within ±1 day • Cloud-free scene available
User sees: map evidence, spectral signal, BFAR reference status, and whether the system has enough evidence to classify or abstain.
02 • Disaster Management
L-Baha-PH
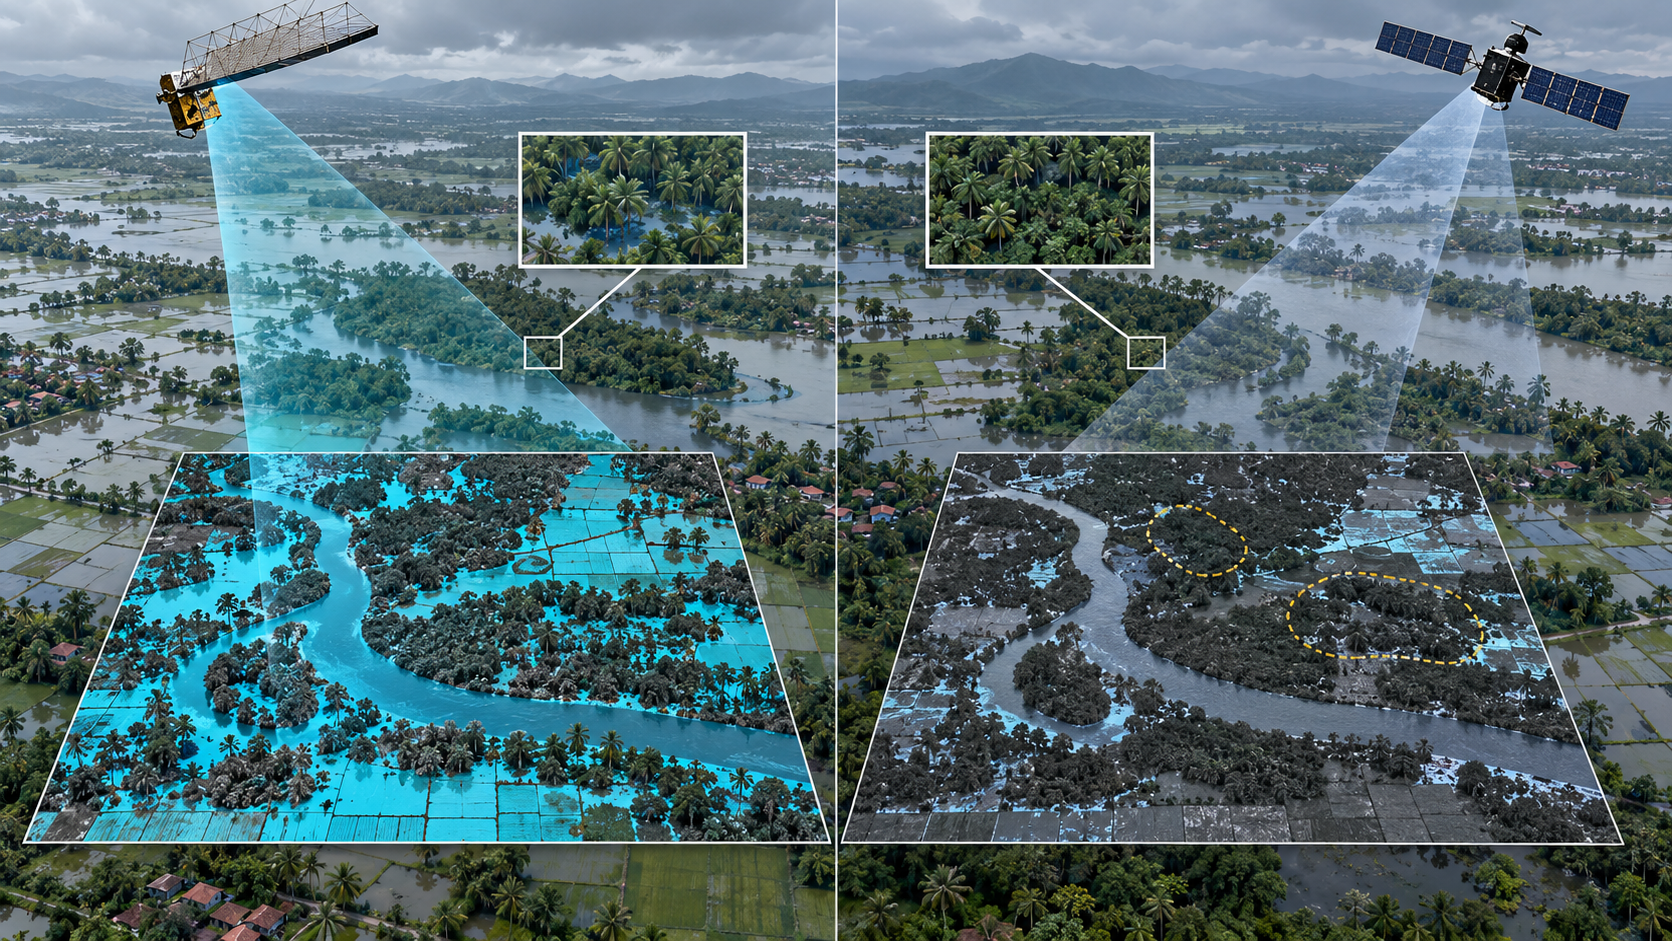
Can NISAR L-band see flooding better under rice and dense vegetation?
The system compares the same Philippine flood event using two radar wavelengths. Sentinel-1 uses C-band; NISAR uses the longer L-band signal, which may behave differently in vegetation. The thesis measures where the two sensors agree, disagree, or fail to observe the flood.
Think of it like this: two flashlights are looking through tall grass at floodwater. One wavelength may “see” the water better under vegetation. Your thesis tests that instead of assuming it.
NISAR, Sentinel-1, PhilSA event products/shapefiles, and optional crop/land-cover masks.
Why it matters
PhilSA notes that SAR flood maps can underestimate inundation in densely vegetated areas.
Main kill gate
Need at least one strong 2026 Philippine flood with NISAR and Sentinel-1 acquisitions close enough in time for a fair comparison.
Concept image — cross-sensor flood visibility
Illustrative concept: NISAR L-band and Sentinel-1 C-band can be compared over the same vegetated flood event. This image does not show measured performance.
Concept mockup — cross-sensor flood comparison
L-Baha-PH / event comparison
Flood visibility comparisonEVENT 2026
Same flood, two radar sensors
Sentinel-1 C-band
NISAR L-band
Vegetated flood recall+18 pts
Reference flood area recovered
C-band 58%
L-band 76%
Example onlyNumbers illustrate what the final evaluation screen could show.
User sees: a side-by-side map and the exact zones where one radar sensor recovers flood evidence the other misses.
03 • Environment
Biomass-GEDI-PH
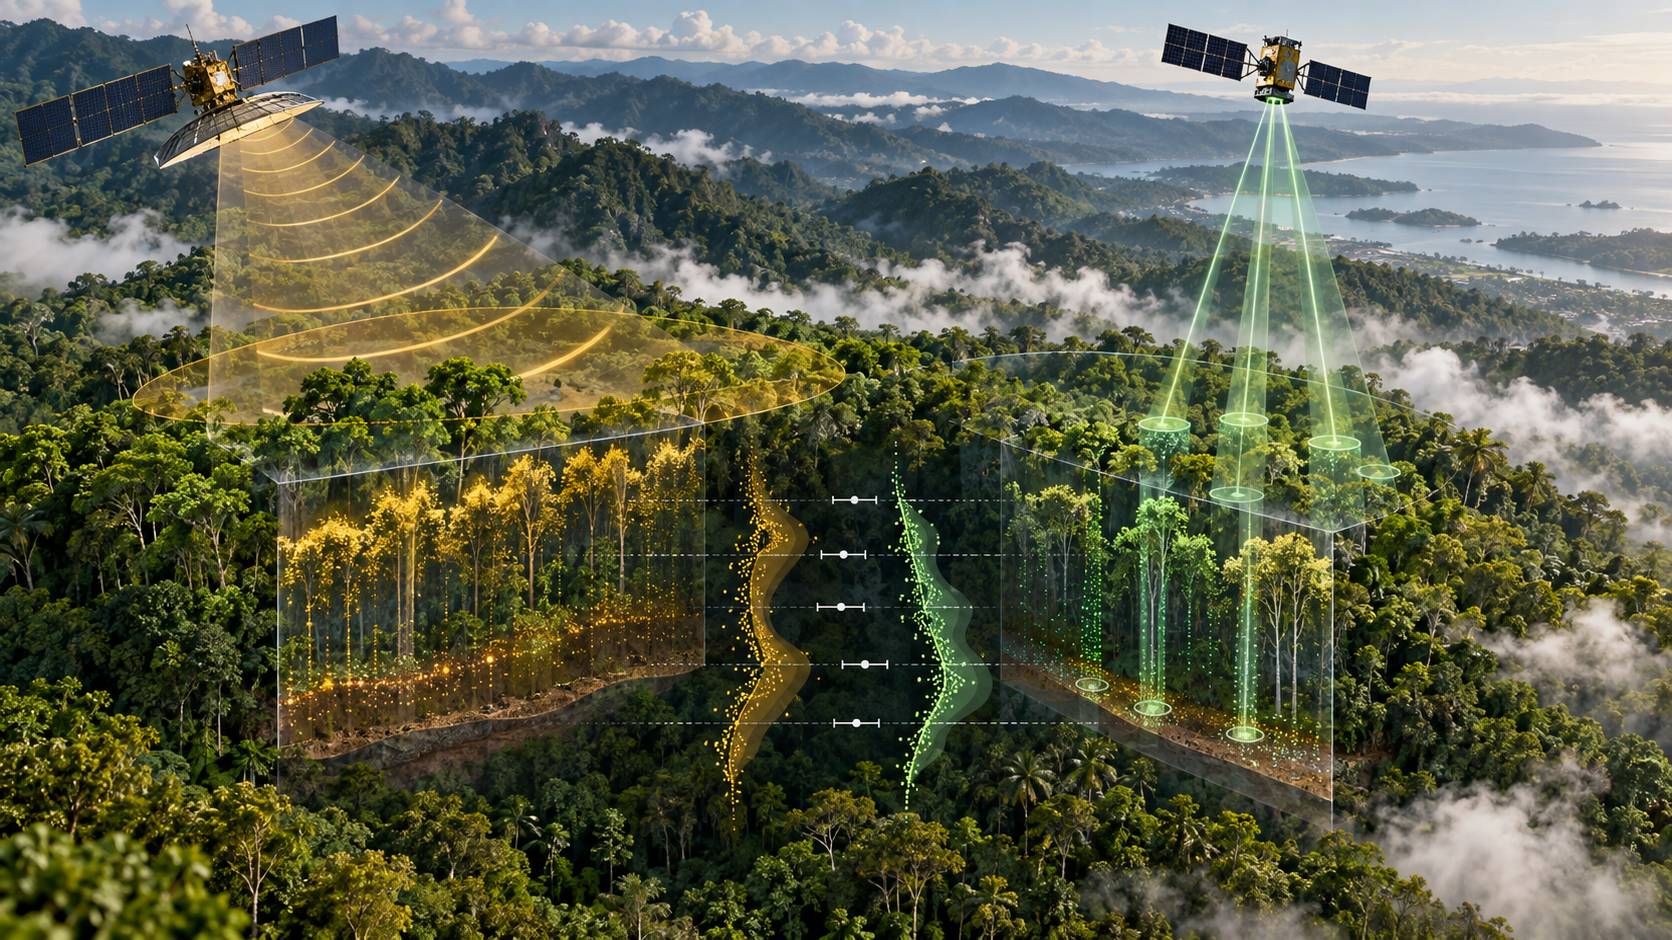
Do P-band radar and space lidar tell a consistent story about Mindanao forests?
The thesis compares forest-structure signals from ESA’s new Biomass P-band radar with GEDI’s laser-based canopy measurements. Instead of trying to invent a forest map from scratch, it studies when the two independent sensors agree and when the system should say “uncertain.”
Think of it like this: one satellite “feels” forest structure using long-wavelength radar, while another measures tree height with laser pulses. Your research checks whether those two measuring tools agree in tropical forests.
ESA Biomass P-band products and GEDI V3 L2A/L2B; Sentinel layers can filter recent forest change.
Why it is interesting
Biomass is the first spaceborne P-band SAR mission, giving the project a genuinely new sensing modality.
Main kill gate
Need an actual Mindanao Biomass scene with enough quality GEDI footprint overlap and acceptable time mismatch.
Concept image — P-band and lidar forest structure
Illustrative concept: ESA Biomass P-band radar and GEDI lidar provide different views of forest structure that can be matched and evaluated. This is not a measured study result.
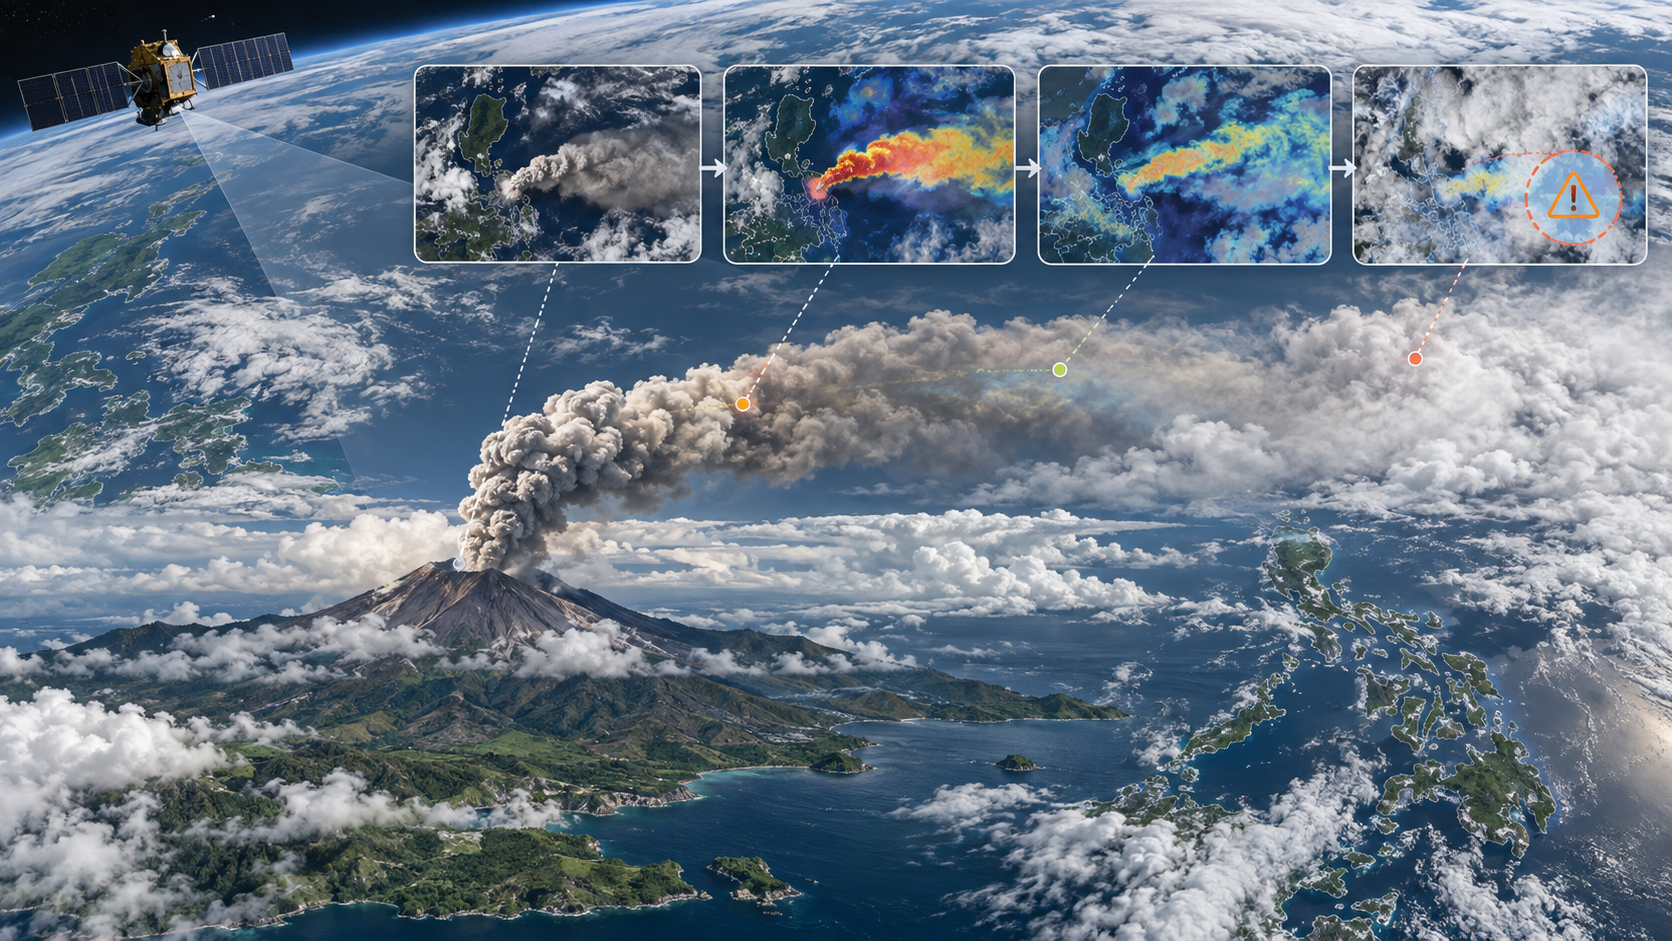
The system reads a sequence of Himawari-9 multispectral images around volcanic eruptions, then tests whether a model trained on some events can recognize ash in completely different events. It should also learn to abstain when clouds or weak signals make ash impossible to identify.
Think of it like this: instead of teaching AI one picture of smoke, you show it a short satellite “movie” of an eruption and ask whether the lesson still works on another volcano or date.
1. EventsCollect PH eruption windows
2. FramesHimawari multispectral sequence
3. LearnEvent-held-out model
4. DecideAsh / no ash / abstain
What makes it CS
Multispectral sequence modeling, event-held-out evaluation, class imbalance handling, confidence calibration, and temporal visualization.
Reference data
Tokyo VAAC advisories provide eruption times, plume information, and useful “VA not identifiable” cases.
Why it matters
A model that only works on one eruption is weak. The research tests generalization across independent events.
Main kill gate
Need enough independent eruption events and reliable time-aligned labels. If plume masks are too weak, narrow to event classification/reliability.
Concept image — volcanic ash sequence monitoring
Illustrative concept: a Himawari-9 image sequence could be evaluated against volcanic-ash advisories across separate eruption events. This is not a measured study result.
Concept mockup — volcanic ash event viewer
AshCast-PH / eruption event
Volcanic ash sequence reviewEVENT HELD OUT
Himawari multispectral frame
Model plume region • 02:30 UTC
Event timeline
02:10VAAC: ash observed
02:20Model: ash 0.83
02:30Model: ash 0.89
02:40Cloud conflict → abstain
User sees: the satellite frame, model confidence over time, the advisory reference, and exactly when the system refuses to make a confident claim.
05 • Disaster Management
SlopeL-PH
Does L-band preserve better landslide evidence on vegetated slopes?
85/100
ExploratoryNISAR L-bandSentinel-1NASA COOLR
Rather than making another landslide-susceptibility map, this thesis focuses on sensor observability. Around known rainfall-triggered landslides, it checks whether NISAR L-band preserves more useful deformation/coherence-change evidence than Sentinel-1 C-band on vegetated slopes.
Think of it like this: after a slope fails, two radar sensors look at the same mountain. Your research asks which one keeps a clearer “before versus after” signal under vegetation.
User sees: the known landslide location, pre/post radar evidence, vegetation context, and whether either sensor provides a trustworthy comparison.
Second research round • non-satellite technology
Non-Satellite Ideas — Real-Data Preflight
This round deliberately moves away from satellite-heavy concepts. The technologies here include tide gauges, government-document NLP, time-series change detection, graph algorithms, acoustic sensing, agricultural market networks, and seismic waveforms.
What changed: these are not just brainstormed titles. We ran a real-data preflight first. TideSentinel-PH and VolcaShift-PH passed strongly; AgriShockGraph-PH passed after narrowing scope; ReliefRoute-PH is conditional because of report-ingestion friction; PinatuboOOD-PH is explicitly on hold because its live waveform access gate was not proven. Scores remain screening scores, not final title-approval rankings.
PASS • REAL DATA TESTED
TideSentinel-PH
Tide gauges + signal processing + anomaly detection
95screening
Three water-level sensors watching the same event
Question: Can a detector trained on one Philippine tide gauge recognize long-wave anomalies at another station while rejecting single-sensor glitches?
What we actually proved
Downloaded 1,747 Davao records from a real 2026 event window.
Three water-level channels contributed 546 samples each.
Comparable channels showed similar large departures, while another channel had an isolated spike—useful for multi-sensor consensus research.
What makes it CS
Signal detrending, anomaly detection, cross-station transfer, sensor-fault rejection, confidence calibration and abstention.
Next kill gate
Assemble several normal-weather and tsunami/earthquake windows across Davao, Manila, Legaspi and another usable station.
PASS • REAL DATA TESTED
VolcaShift-PH
NLP + multivariate time series + change-point detection
93screening
Bulletins become a structured unrest timeline
Question: Can statistically meaningful regime changes in public PHIVOLCS monitoring indicators be detected near official alert-level transitions?
What we actually proved
Retrieved 30 Kanlaon daily bulletins around the December 2024 transition.
Parsed date, alert level and SO₂ from 30/30 tested pages.
The test window crosses the December 9 Alert 2 → Alert 3 transition.
Question: Can road-status statements automatically extracted from disaster reports update a road graph through time and produce better routes than a static shortest-path baseline?
What we actually proved
NDRRMC Region XI reports contain explicit road/bridge status changes such as not passable, one-lane/light-vehicle passable and fully passable.
OpenStreetMap can provide the base road graph offline.
Direct scripted download of the tested NDRRMC attachment returned HTTP 403, so collection automation is the current friction point.
What makes it CS
Information extraction, entity matching, graph updates, robust routing and ambiguity handling.
Next kill gate
Assemble 50–100 Region XI report updates and prove road names can be matched to OSM with acceptable ambiguity.
Question: Can a temporal graph detect abnormal agricultural price shocks and changes in inter-province relationships better than independent per-province time-series baselines?
What we actually proved
Queried the live PSA OpenSTAT API for six Davao geographies × three cereal commodities × monthly periods.
Palay coverage is about 95–96% for most useful Davao areas.
White corn coverage is about 81–94% in the stronger series; yellow corn is too sparse in many provinces and should initially be excluded.
What makes it CS
Temporal graph construction, anomaly/shock detection, cross-province transfer, graph-change analysis and missing-data handling.
Next kill gate
Use palay + white corn only, define objective shock labels, and compare graph models against strong time-series baselines.
BACKUP
RainHear-Transfer-PH
Acoustic sensing + audio machine learning
84screening
Rain intensity encoded in ordinary microphone audio
Question: Can rainfall intensity estimated from ordinary microphone/CCTV audio transfer across different microphones, roof/surface types and locations?
Why it stays as backupOpen labeled rainfall-audio datasets already make the base pipeline feasible. The stronger Philippine contribution would come from testing transfer on a small local Tagum/Davao smartphone or CCTV validation set paired with a trusted rainfall reference.
Without a local validation set, the Philippine-specific contribution is weaker than TideSentinel-PH or VolcaShift-PH.
HOLD • ACCESS GATE FAILED
PinatuboOOD-PH
Seismic waveforms + domain adaptation
76screening
Legacy volcanic waveform transfer testDATA ACCESS NOT PROVEN
Question: How reliable are modern seismic phase-picking models when transferred to noisy legacy Philippine volcanic waveforms they were not trained on?
Why it is on holdFDSN metadata describes waveforms, phase arrivals, hypocenters and station locations for the 1991 Pinatubo archive, but the tested station/fedcatalog endpoints returned no usable data. The existence of a dataset description is not enough to lock a thesis.
What makes it CS
Out-of-distribution evaluation, phase picking, model calibration, domain shift analysis and selective prediction.
Decision
Bench until an actual MiniSEED/event archive can be downloaded and inspected end-to-end.
Consultation shortlist after preflight
The strongest non-satellite directions are the ones where both the problem and the data path are already concrete. This ordering is for what to discuss first, not a final title approval.
ReliefRoute-PH — high practical value if the report corpus can be stabilized.
AgriShockGraph-PH — strongest agriculture representative after narrowing scope.
RainHear-Transfer-PH — clean backup.
PinatuboOOD-PH — keep benched until data access is proven.
How the original five fit the agenda
Environment: PACE-HAB-PH and Biomass-GEDI-PH. Disaster Management: L-Baha-PH, AshCast-PH, and SlopeL-PH. None of these five is an Agriculture replacement because the strongest new candidates from this particular replacement loop came from newer Earth-observation sensors and event data.
The two first-pass candidates to preflight are PACE-HAB-PH and L-Baha-PH: PACE-HAB has the cleaner Philippine reference-label path, while L-Baha has the stronger new-sensor novelty.